Changelog
Version 1.4.0
Experience-based Assistant
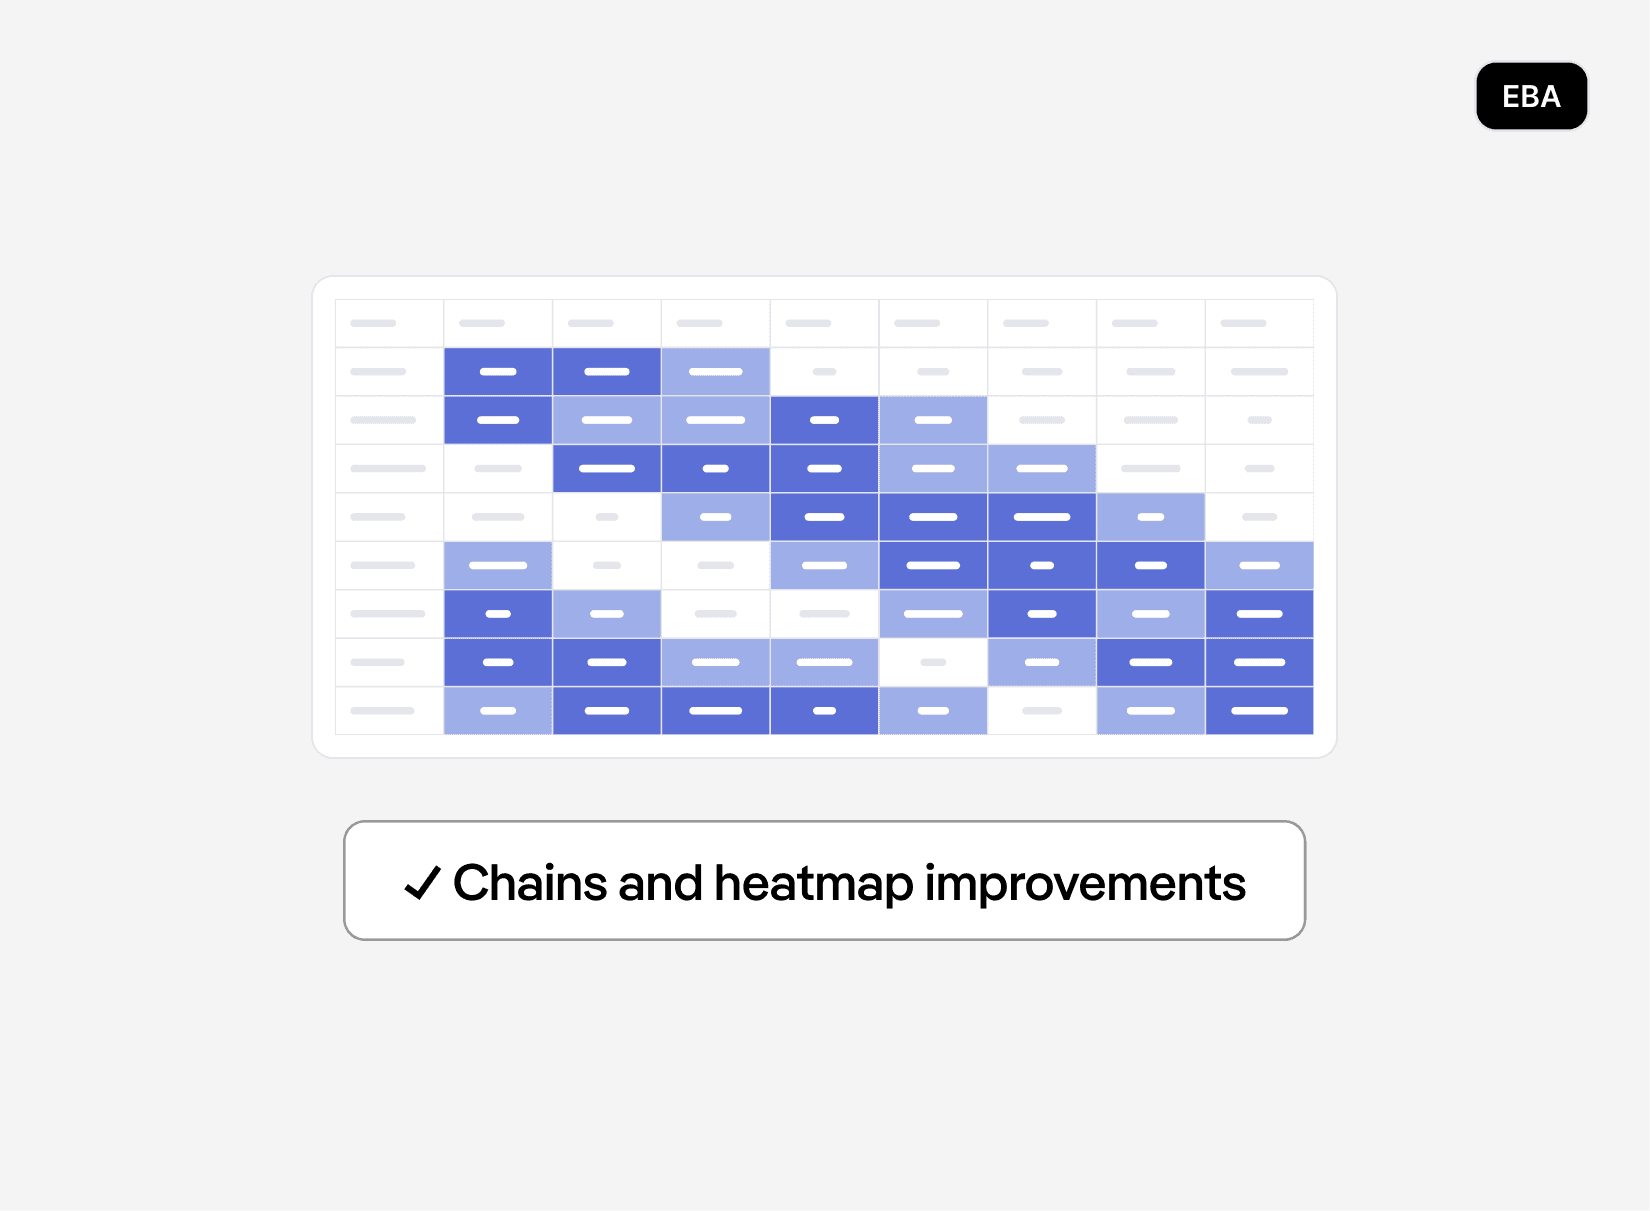
Chains are now officially available and heatmap improvements
Chains are now officially available to all users. With this release, creating and understanding connections becomes even easier: AI-powered suggestions now help you link related entries faster, and linked logbook entries are displayed directly in the Insights panel, giving you the full context of a chain at a glance. At the same time, the Heatmap is becoming more flexible. You can now open it in fullscreen mode, making it ideal for large plant overviews and production monitors.
Benefits: AI-powered suggestions make chains faster to create, while linked logbook entries in the Insights panel provide clearer context at a glance. Fullscreen mode improves Heatmap visibility on large screens, and custom sorting helps users tailor the view for faster orientation.
Version 1.4.0
Experience-based Assistant
Chains are now officially available and heatmap improvements
Chains are now officially available to all users. With this release, creating and understanding connections becomes even easier: AI-powered suggestions now help you link related entries faster, and linked logbook entries are displayed directly in the Insights panel, giving you the full context of a chain at a glance. At the same time, the Heatmap is becoming more flexible. You can now open it in fullscreen mode, making it ideal for large plant overviews and production monitors.
Benefits: AI-powered suggestions make chains faster to create, while linked logbook entries in the Insights panel provide clearer context at a glance. Fullscreen mode improves Heatmap visibility on large screens, and custom sorting helps users tailor the view for faster orientation.
Version 1.3.0
iDOO Portal
Optimizing updates from edge services
Easier update mechanism between the edge services and the portal.
Version 1.3.0
iDOO Portal
Optimizing updates from edge services
Easier update mechanism between the edge services and the portal.
Version 1.5.0
Secure Edge Services
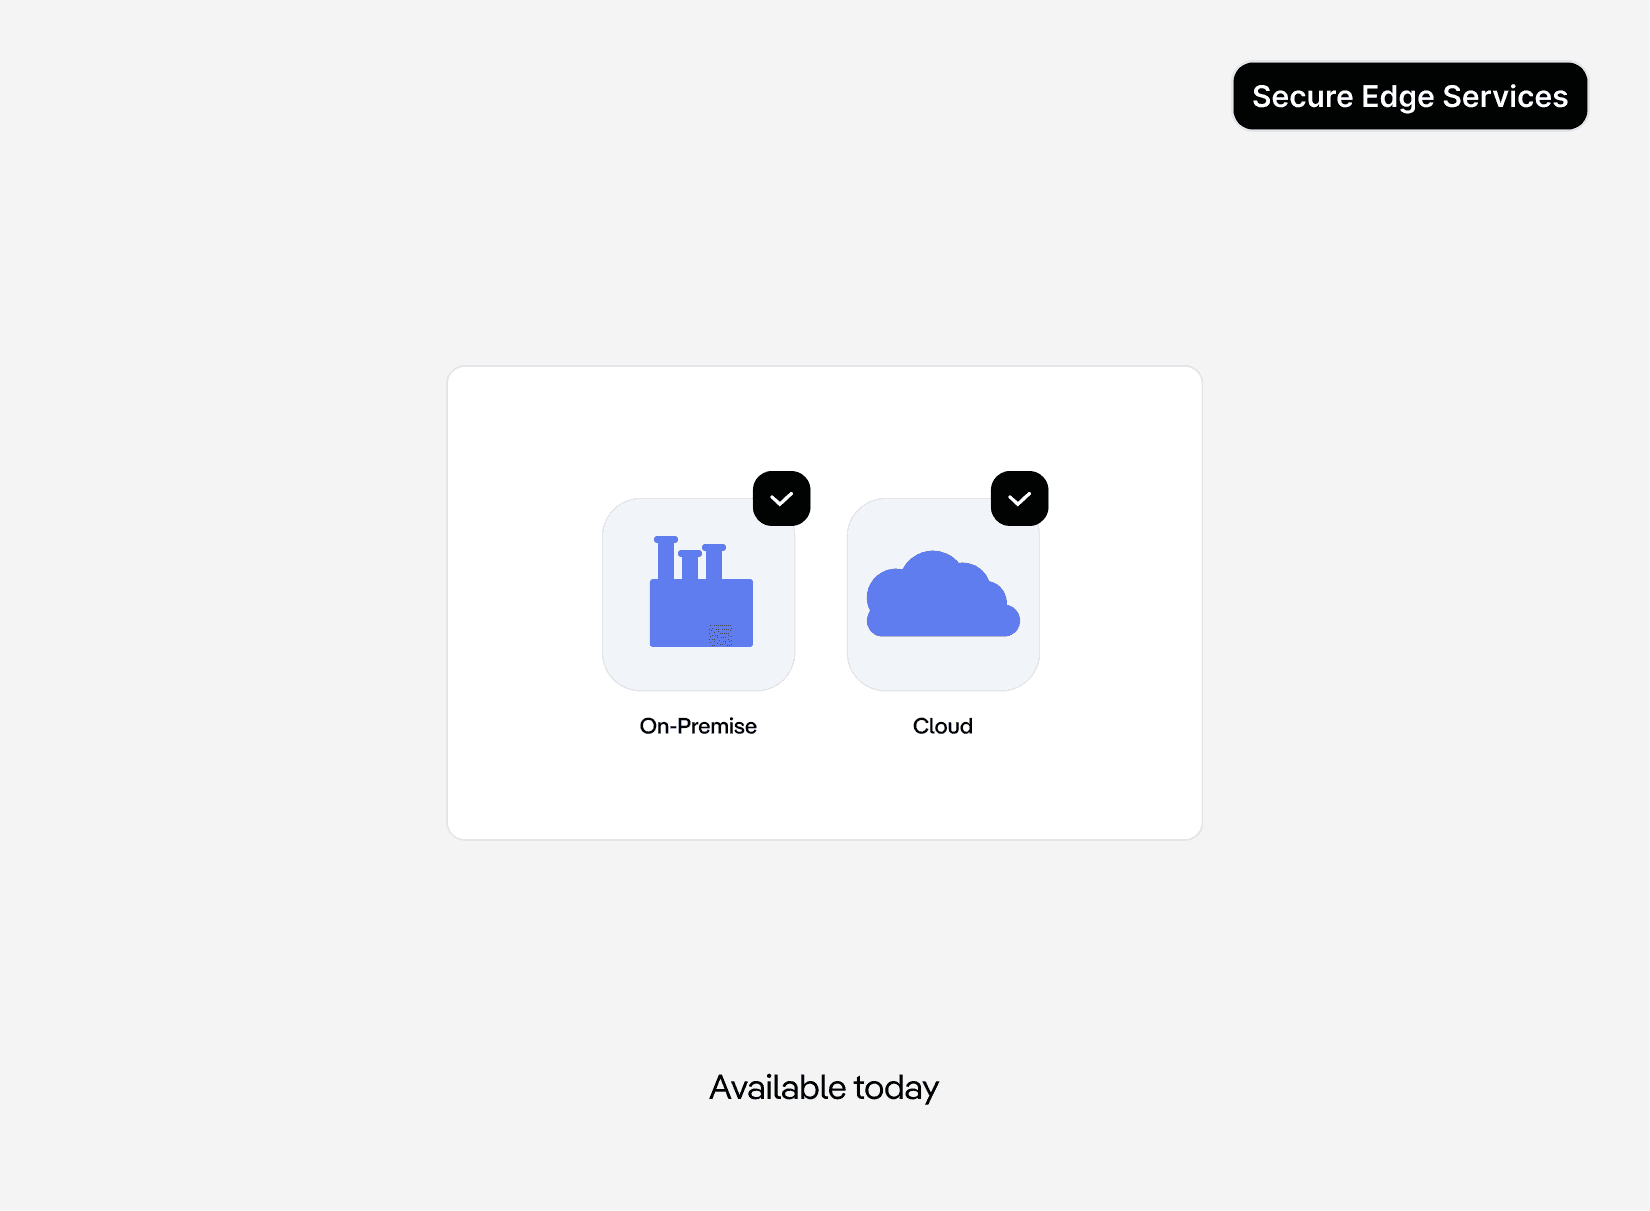
Open ecosystem & data sovereignty: manage any Linux device - anywhere, On-Premises or Cloud
Expansion of fleet management capabilities to any Linux-based controllers (PLCs/IPCs), optional On-Premises or Private Cloud architecture deployment, alongside the introduction of centralized log streaming and remote certificate rollouts.
Benefits: Complete hardware independence and data sovereignty. Manage heterogenous machine fleets centrally and securely within your own IT infrastructure. Maintenance workflows are significantly accelerated through automated certificate updates and direct log streaming.
Version 1.5.0
Secure Edge Services
Open ecosystem & data sovereignty: manage any Linux device - anywhere, On-Premises or Cloud
Expansion of fleet management capabilities to any Linux-based controllers (PLCs/IPCs), optional On-Premises or Private Cloud architecture deployment, alongside the introduction of centralized log streaming and remote certificate rollouts.
Benefits: Complete hardware independence and data sovereignty. Manage heterogenous machine fleets centrally and securely within your own IT infrastructure. Maintenance workflows are significantly accelerated through automated certificate updates and direct log streaming.
Version 1.8.0
Industrial Data Manager
Multisensor add‑ons, smart compression, and robust KPIs
This release adds multisensor integration (temperature, pressure, humidity), smart swinging-door compression and noise filtering in collectors, faster shop-floor event attribution, and more robust time-weighted KPIs with linear TWA fill support.
Benefits:
Multisensor Integration: Temeprature, Pressure, Humidity as add-on sensors.
Intelligent swinging-door compression: Introduction of advanced data compression algorithms directly in the IDM collectors. Your benefit: Drastically reduces stored data volume without losing process trends or anomalies, saving storage space and massively speeding up exports.
Enhanced noise filtering: Collectors automatically filter out insignificant signal fluctuations and sensor noise. Only relevant, stable values load your network infrastructure and time-series databases.
Instant event attribution on the shop floor: Manual creation of production events (such as unplanned downtimes or batch changes) now allows immediate, direct entry of event properties and quality data in a single step.
Support for linear TWA fill types: Increased calculation robustness for time-weighted averages (TWA). KPIs continue to run reliably even if individual input values temporarily fail or have poor quality.
Version 1.8.0
Industrial Data Manager
Multisensor add‑ons, smart compression, and robust KPIs
This release adds multisensor integration (temperature, pressure, humidity), smart swinging-door compression and noise filtering in collectors, faster shop-floor event attribution, and more robust time-weighted KPIs with linear TWA fill support.
Benefits:
Multisensor Integration: Temeprature, Pressure, Humidity as add-on sensors.
Intelligent swinging-door compression: Introduction of advanced data compression algorithms directly in the IDM collectors. Your benefit: Drastically reduces stored data volume without losing process trends or anomalies, saving storage space and massively speeding up exports.
Enhanced noise filtering: Collectors automatically filter out insignificant signal fluctuations and sensor noise. Only relevant, stable values load your network infrastructure and time-series databases.
Instant event attribution on the shop floor: Manual creation of production events (such as unplanned downtimes or batch changes) now allows immediate, direct entry of event properties and quality data in a single step.
Support for linear TWA fill types: Increased calculation robustness for time-weighted averages (TWA). KPIs continue to run reliably even if individual input values temporarily fail or have poor quality.
Version 1.3.0
Experience-based Assistant
Connected troubleshooting through machine data integration
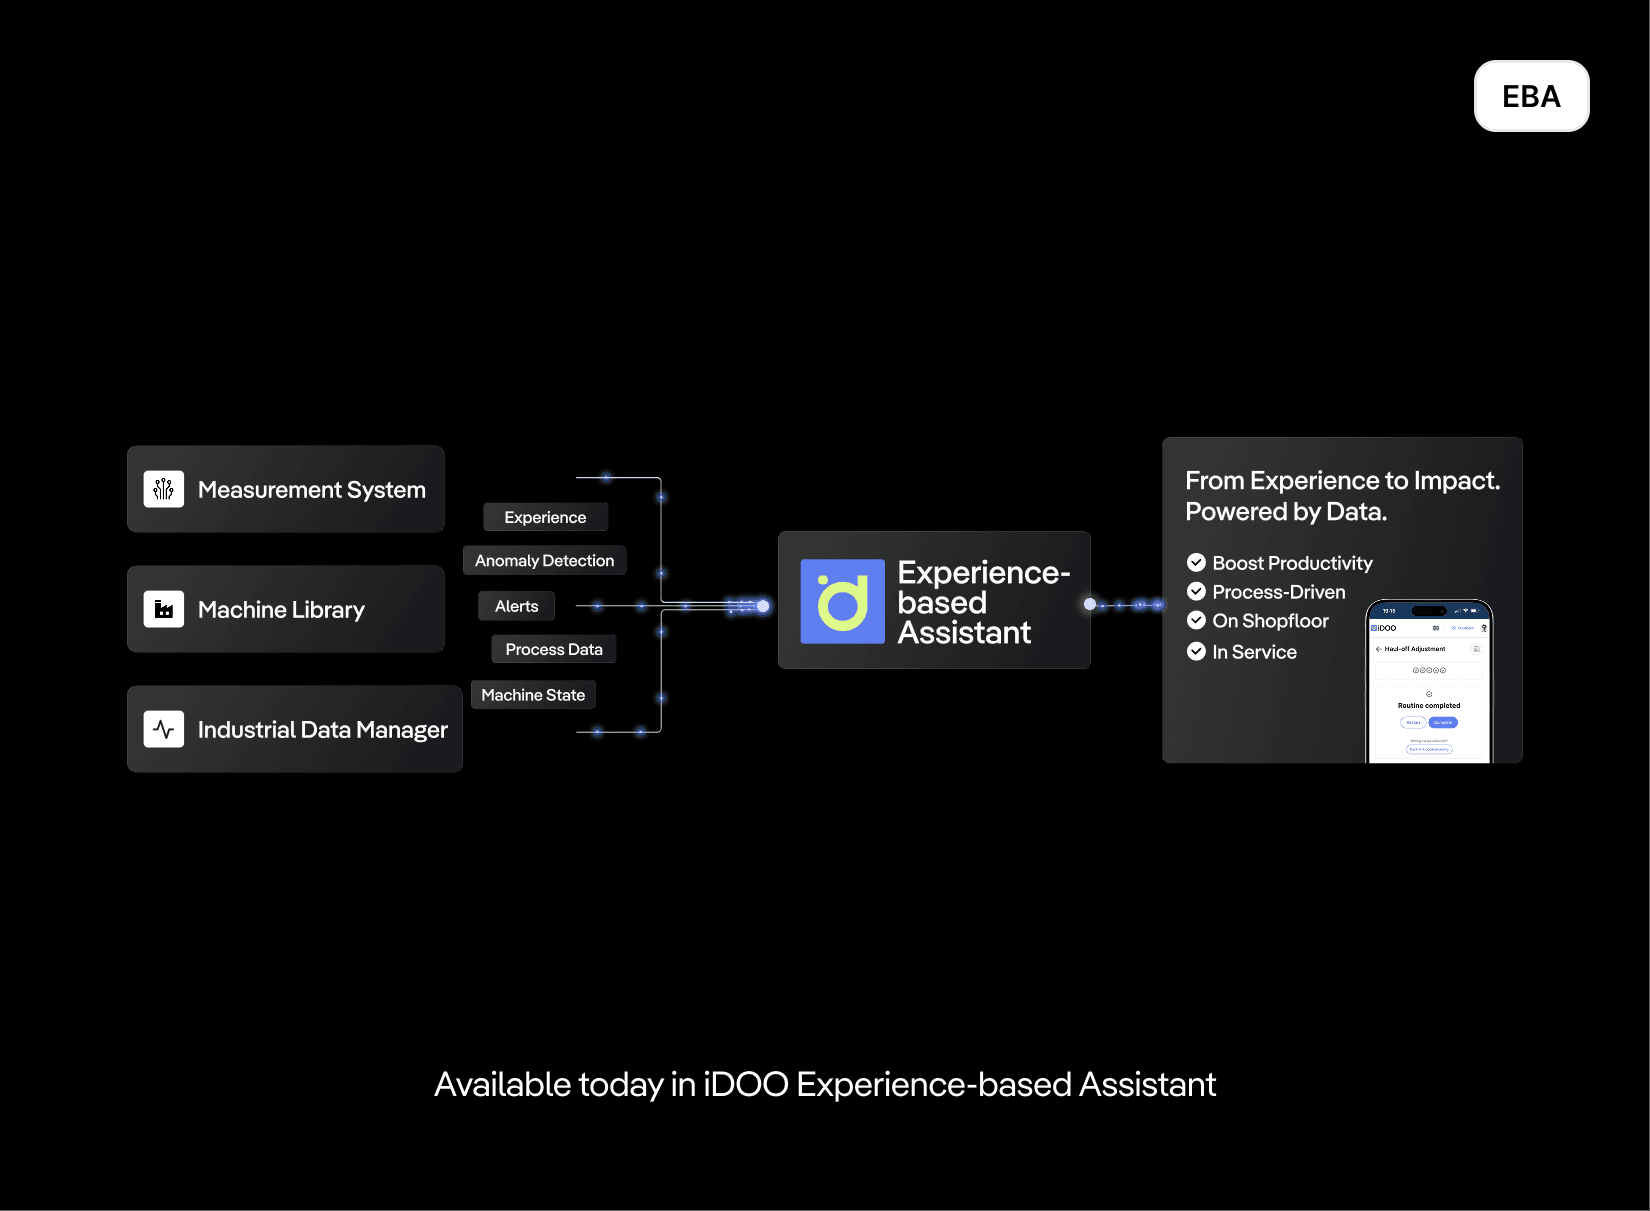
Integration of gravimetric and measurement systems. Machine data, process parameters, and error codes are combined with troubleshooting knowledge for comprehensive diagnostics and guided root-cause analysis.
Benefits: Significantly reduced troubleshooting time, improved diagnostic accuracy, automated root-cause identification, and more efficient resolution of complex machine issues.
Version 1.3.0
Experience-based Assistant
Connected troubleshooting through machine data integration
Integration of gravimetric and measurement systems. Machine data, process parameters, and error codes are combined with troubleshooting knowledge for comprehensive diagnostics and guided root-cause analysis.
Benefits: Significantly reduced troubleshooting time, improved diagnostic accuracy, automated root-cause identification, and more efficient resolution of complex machine issues.
Version 1.4.0
Secure Edge Services
Future-proofing the shop floor against next-gen cyber threats
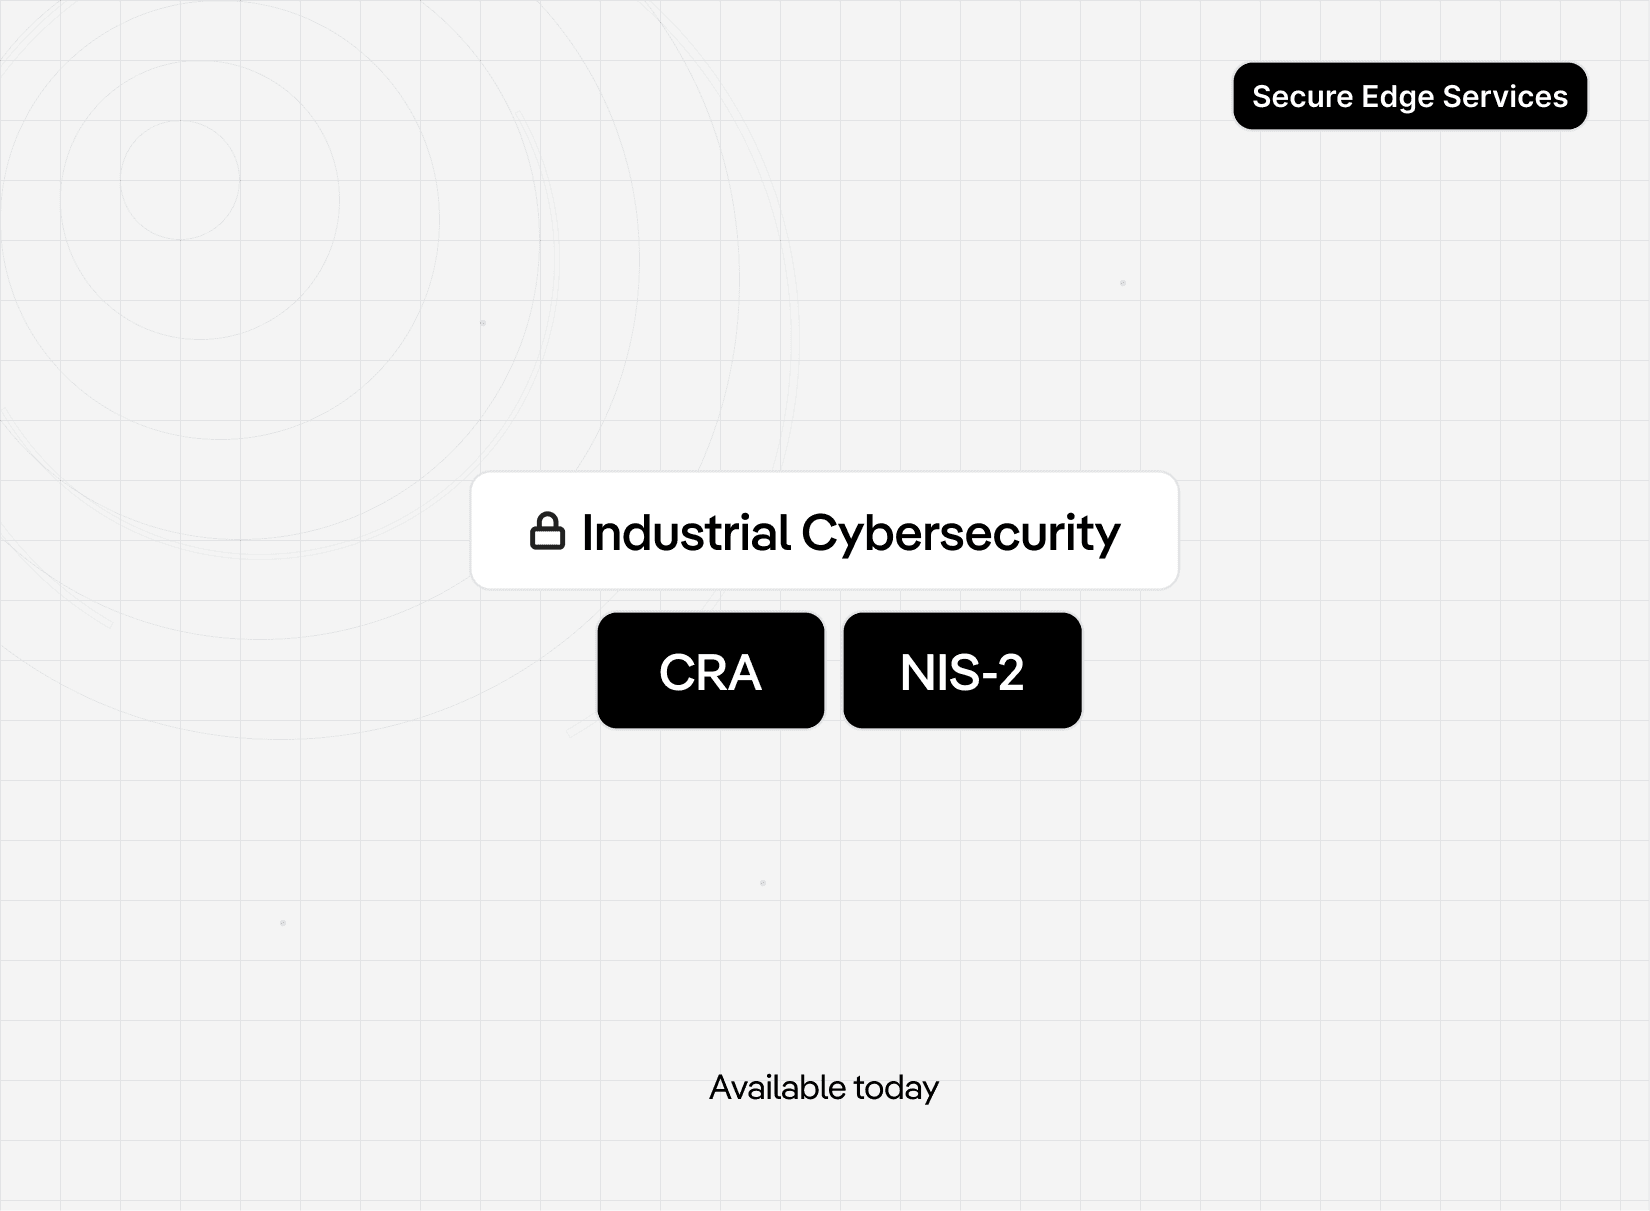
Implementation of automated patch management compliant with the Cyber Resilience Act (CRA) and NIS-2 directives, enforcement of tenant-wide 2FA, standardized Docker app catalogs, and a new REST API for fleet performance metrics.
Benefits: Compliance and zero-trust on the shop floor. Your operations automatically meet the latest European cybersecurity regulations. Additionally, software-defined analytics functions can be deployed globally without errors using the standardized app catalog.
Version 1.4.0
Secure Edge Services
Future-proofing the shop floor against next-gen cyber threats
Implementation of automated patch management compliant with the Cyber Resilience Act (CRA) and NIS-2 directives, enforcement of tenant-wide 2FA, standardized Docker app catalogs, and a new REST API for fleet performance metrics.
Benefits: Compliance and zero-trust on the shop floor. Your operations automatically meet the latest European cybersecurity regulations. Additionally, software-defined analytics functions can be deployed globally without errors using the standardized app catalog.
Version 1.2.0
iDOO Portal
New administration backend
Administration for users, groups and role permissions
Mapping of organizational structures and plants
Benefits: Simple and comprehensive administration of users and organizations
Version 1.2.0
iDOO Portal
New administration backend
Administration for users, groups and role permissions
Mapping of organizational structures and plants
Benefits: Simple and comprehensive administration of users and organizations
Version 1.7.0
Industrial Data Manager
New historian home, quick filters, and powerful bulk actions
This update introduces a central Historian home screen for at‑a‑glance system status, faster data exploration with inline quick filters, seamless variable overrides in saved queries, and bulk editing/deletion for time-series data and configurations.
Benefits:
Central Historian home screen & status center: A completely new start screen aggregates system statistics, the status of sub-organizations, and the latest changes. Your benefit: Operators can assess system health and data integrity at a glance, without having to search through submenus.
Faster data exploration through quick filters: Introduction of inline filters and dynamic groupings directly in the user interface. Data sets can be sorted by lines or shifts within seconds.
Seamless variable substitution in saved queries: You can now override dashboard variables inline when selecting a saved query, without modifying the original template. This drastically increases the reusability of analyses.
Mass data operations (bulk editing & deletion): Time-series data and configurations for measurements and calculations can now be edited or deleted in large batches (bulk). This saves hours of repetitive configuration work for large plants.
Version 1.7.0
Industrial Data Manager
New historian home, quick filters, and powerful bulk actions
This update introduces a central Historian home screen for at‑a‑glance system status, faster data exploration with inline quick filters, seamless variable overrides in saved queries, and bulk editing/deletion for time-series data and configurations.
Benefits:
Central Historian home screen & status center: A completely new start screen aggregates system statistics, the status of sub-organizations, and the latest changes. Your benefit: Operators can assess system health and data integrity at a glance, without having to search through submenus.
Faster data exploration through quick filters: Introduction of inline filters and dynamic groupings directly in the user interface. Data sets can be sorted by lines or shifts within seconds.
Seamless variable substitution in saved queries: You can now override dashboard variables inline when selecting a saved query, without modifying the original template. This drastically increases the reusability of analyses.
Mass data operations (bulk editing & deletion): Time-series data and configurations for measurements and calculations can now be edited or deleted in large batches (bulk). This saves hours of repetitive configuration work for large plants.
Version 1.2.0
Experience-based Assistant
Turning service experience into actionable insights
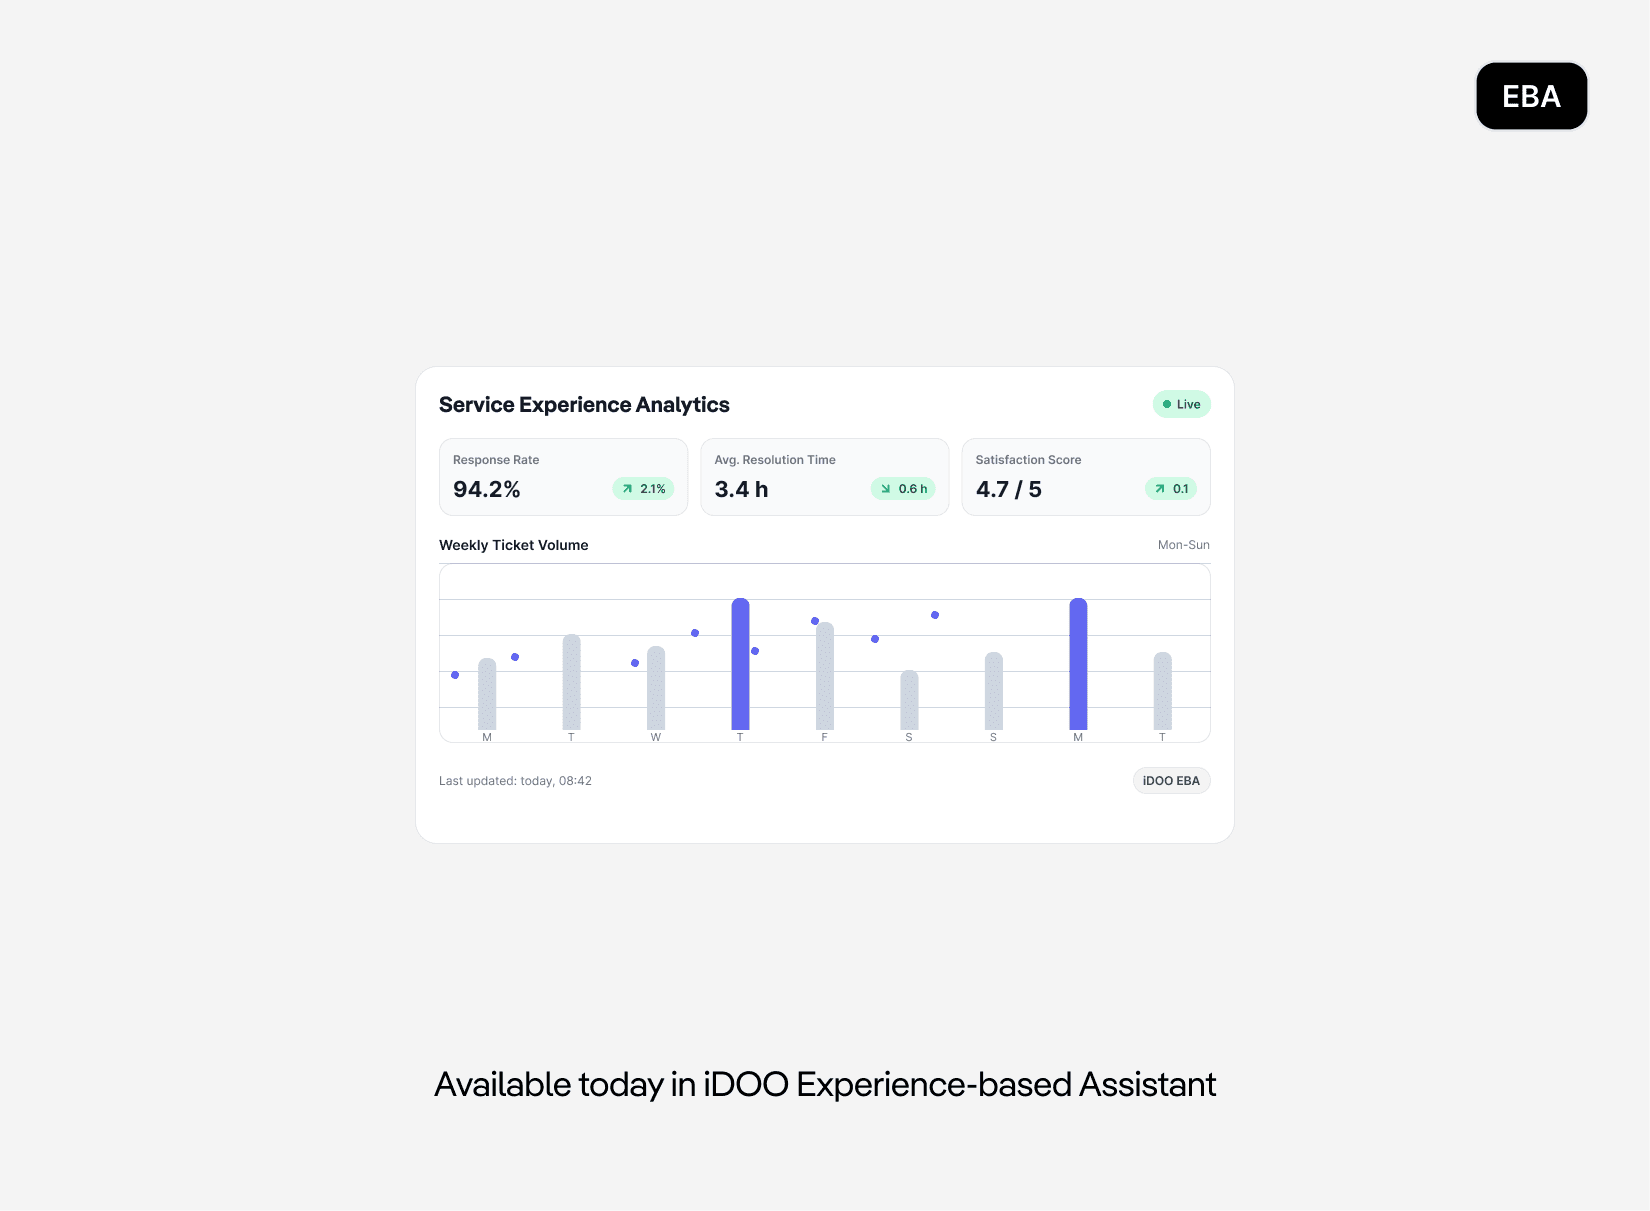
Introduction of analytics capabilities to evaluate troubleshooting activities, identify knowledge gaps, detect recurring issues, and measure the impact of the EBA on service performance.
Benefits: Increased transparency into service performance, data-driven product optimization, targeted knowledge development, and continuous improvement of support processes.
Version 1.2.0
Experience-based Assistant
Turning service experience into actionable insights
Introduction of analytics capabilities to evaluate troubleshooting activities, identify knowledge gaps, detect recurring issues, and measure the impact of the EBA on service performance.
Benefits: Increased transparency into service performance, data-driven product optimization, targeted knowledge development, and continuous improvement of support processes.
Version 1.2.0
iDOO Product Quality Pass
Extended pipe inspection support for CP-pipes, liners, and corrugated structures
This release expands the inspection scope beyond plain pipes by adding support for CP-pipes and liner-based use cases, including liners for hydrogen pressure vessels. In addition, the system now supports corrugated pipe structures and liner measurements captured with WARP gauge systems.
Benefits: Users can apply iDOO to a wider range of technical components and measurement scenarios, including complex pipe geometries and liner applications. Support for WARP-based liner measurement increases compatibility with existing gauge systems, while the extended inspection scope improves flexibility, consistency, and technical traceability across different use cases.
Version 1.2.0
iDOO Product Quality Pass
Extended pipe inspection support for CP-pipes, liners, and corrugated structures
This release expands the inspection scope beyond plain pipes by adding support for CP-pipes and liner-based use cases, including liners for hydrogen pressure vessels. In addition, the system now supports corrugated pipe structures and liner measurements captured with WARP gauge systems.
Benefits: Users can apply iDOO to a wider range of technical components and measurement scenarios, including complex pipe geometries and liner applications. Support for WARP-based liner measurement increases compatibility with existing gauge systems, while the extended inspection scope improves flexibility, consistency, and technical traceability across different use cases.
Version 1.6.0
Industrial Data Manager
Support of nearly all iNOEX systems, one‑click toggles, and shareable dashboards
This release adds support for data acquisition from most iNOEX gravimetric and measurement systems since the late 90s, introduces boolean switch variables, one‑click PNG dashboard exports, a consolidated time comparison drawer, and reusable annotation queries.
Benefits:
Support of data acquisition of nearly all iNOEX Gravimetric and measuremnt systems since the late 90’s.
Flexible switch variable type for booleans: A new graphical toggle interface replaces bulky dropdown menus for variables. Ideal for switching filters or conditional logic (e.g. “Show critical alarms only”) on dashboards with a single click.
Export of dashboards as native image file (PNG): Dashboards can be exported as a high‑resolution image with a single click. Benefit: Perfect for easily sharing shift reports or anomaly snapshots via Teams, Slack, or email.
Consolidated time comparison drawer: Panel-specific time settings and historical comparisons (e.g. “This week vs. last week”) can be accessed directly from the visualization, without having to open the entire dashboard in edit mode.
Reusable annotation queries: Queries for dashboard annotations (e.g. maintenance markers) can now be stored, reused, and shared across the organization.
Version 1.6.0
Industrial Data Manager
Support of nearly all iNOEX systems, one‑click toggles, and shareable dashboards
This release adds support for data acquisition from most iNOEX gravimetric and measurement systems since the late 90s, introduces boolean switch variables, one‑click PNG dashboard exports, a consolidated time comparison drawer, and reusable annotation queries.
Benefits:
Support of data acquisition of nearly all iNOEX Gravimetric and measuremnt systems since the late 90’s.
Flexible switch variable type for booleans: A new graphical toggle interface replaces bulky dropdown menus for variables. Ideal for switching filters or conditional logic (e.g. “Show critical alarms only”) on dashboards with a single click.
Export of dashboards as native image file (PNG): Dashboards can be exported as a high‑resolution image with a single click. Benefit: Perfect for easily sharing shift reports or anomaly snapshots via Teams, Slack, or email.
Consolidated time comparison drawer: Panel-specific time settings and historical comparisons (e.g. “This week vs. last week”) can be accessed directly from the visualization, without having to open the entire dashboard in edit mode.
Reusable annotation queries: Queries for dashboard annotations (e.g. maintenance markers) can now be stored, reused, and shared across the organization.
Version 1.3.0
Secure Edge Services
One-click browser access and instant global fleet visibility
Launch of the updated cloud platform featuring interactive fleet dashboards, one-click remote access directly from the browser (no VPN client required), customizable drag-and-drop widgets, and automated bulk onboarding for gateways.
Benefits: Minimized Operational Overhead & Instant Support. Service teams gain a single-pane-of-glass view into worldwide factories and can securely access machines with one click during downtime. Onboarding new gateways is reduced from hours to seconds.
Version 1.3.0
Secure Edge Services
One-click browser access and instant global fleet visibility
Launch of the updated cloud platform featuring interactive fleet dashboards, one-click remote access directly from the browser (no VPN client required), customizable drag-and-drop widgets, and automated bulk onboarding for gateways.
Benefits: Minimized Operational Overhead & Instant Support. Service teams gain a single-pane-of-glass view into worldwide factories and can securely access machines with one click during downtime. Onboarding new gateways is reduced from hours to seconds.
Version 1.1.0
Experience-based Assistant
Expanded troubleshooting intelligence with North American expertise
Extension of the knowledge base with service and troubleshooting expertise from the USA, covering a broader range of machine configurations, applications, and operational scenarios.
Benefits: Improved solution coverage, enhanced support for global organizations, and faster access to relevant expertise from a broader knowledge base.
Version 1.1.0
Experience-based Assistant
Expanded troubleshooting intelligence with North American expertise
Extension of the knowledge base with service and troubleshooting expertise from the USA, covering a broader range of machine configurations, applications, and operational scenarios.
Benefits: Improved solution coverage, enhanced support for global organizations, and faster access to relevant expertise from a broader knowledge base.
Version 1.0.0
iDOO Product Quality Pass
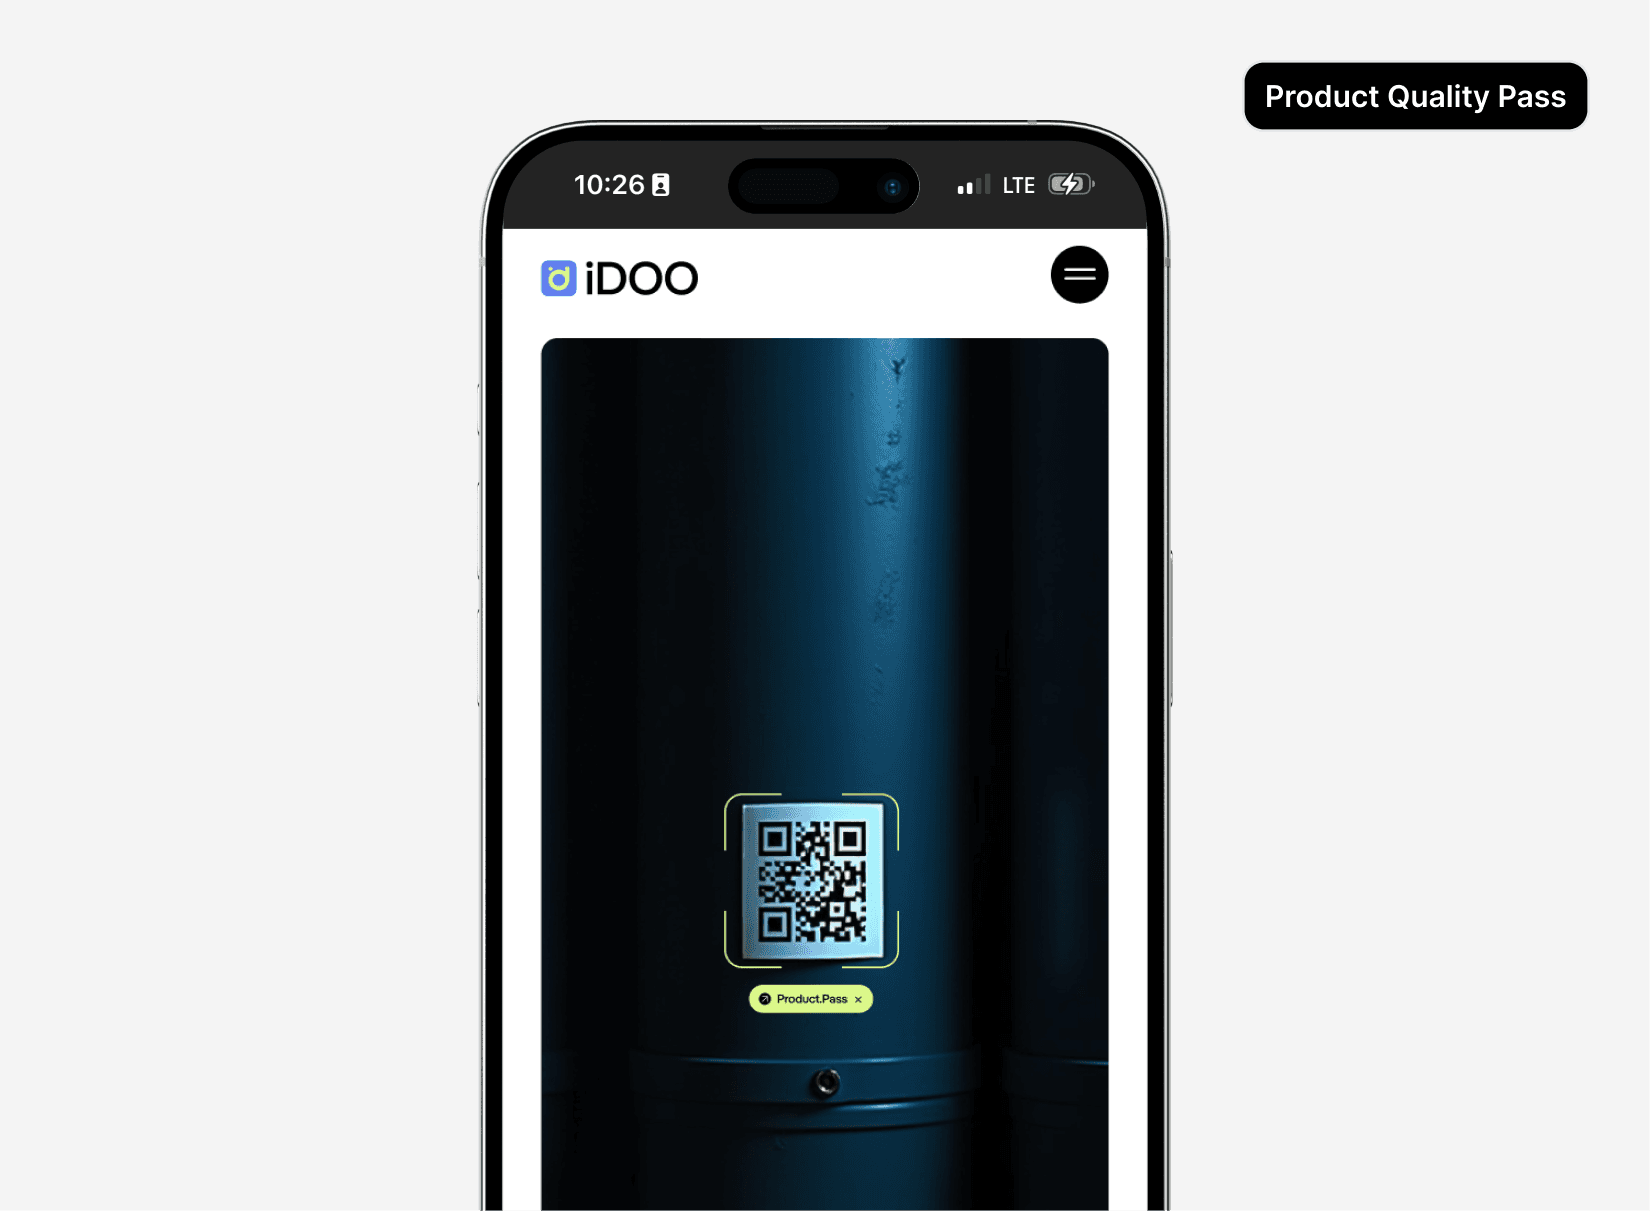
Initial working version with support for plain pipe evaluation
This initial working version introduces the technical foundation for evaluating plain pipes within iDOO. It enables the structured processing of pipe geometry data and supports comparison against predefined reference values and standards, including parameters such as pipe diameter and wall thickness.
Benefits: Users can validate plain pipe measurements against defined standards, creating a more reliable basis for quality assessment. The structured comparison improves transparency in the evaluation process and supports more consistent technical documentation.
Version 1.0.0
iDOO Product Quality Pass
Initial working version with support for plain pipe evaluation
This initial working version introduces the technical foundation for evaluating plain pipes within iDOO. It enables the structured processing of pipe geometry data and supports comparison against predefined reference values and standards, including parameters such as pipe diameter and wall thickness.
Benefits: Users can validate plain pipe measurements against defined standards, creating a more reliable basis for quality assessment. The structured comparison improves transparency in the evaluation process and supports more consistent technical documentation.
Version 1.0.0
iDOO Portal
K 2025 Edition: Everything you need on one platform
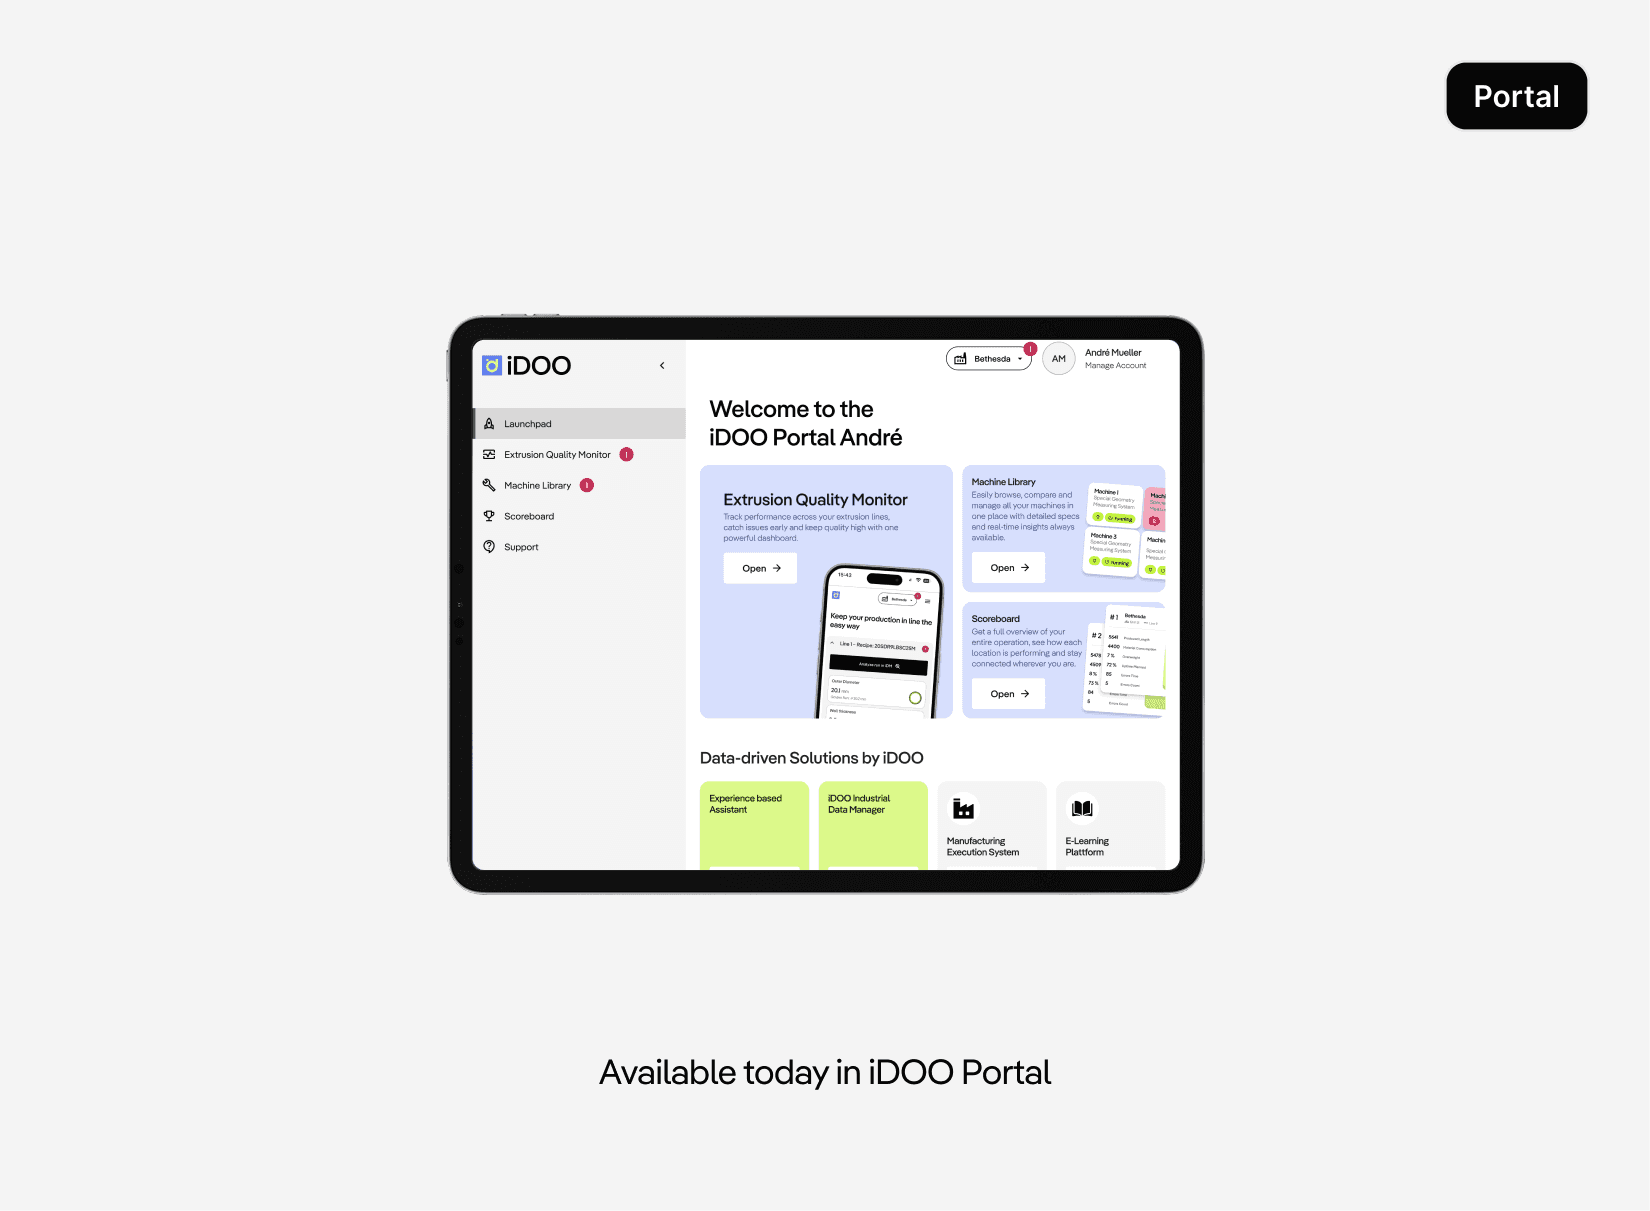
A portal containing all the information. Build-in functionality:
Extrusion quality monitor with the main KPIs
Machine Library with machine state
Scoreboard
Open to integrate 3rd party applications.
Benefits: Track performance across all your extrusion lines, catch issues early and keep quality high with one powerful dashboard. Easily browse, compare and manage all your machinees in one place with detailed specs and realtime insights always available. Get a full overview of your entire operation, see how each location is performing and stay connected wherever you are. Optional integrate your data and services.
Version 1.0.0
iDOO Portal
K 2025 Edition: Everything you need on one platform
A portal containing all the information. Build-in functionality:
Extrusion quality monitor with the main KPIs
Machine Library with machine state
Scoreboard
Open to integrate 3rd party applications.
Benefits: Track performance across all your extrusion lines, catch issues early and keep quality high with one powerful dashboard. Easily browse, compare and manage all your machinees in one place with detailed specs and realtime insights always available. Get a full overview of your entire operation, see how each location is performing and stay connected wherever you are. Optional integrate your data and services.
Version 1.2.0
Secure Edge Services
Risk-free software rollouts with smart cellular resiliency
Introduction of strictly separated Dev/Test/Prod workspaces, time-limited device tokens, granular status tracking for over-the-air (OTA) container updates, and smart packet-retry logic for unstable cellular connections (LTE/5G).
Benefits: Software updates are isolated and validated in test environments before hitting production. Smart data transmission preserves cellular bandwidth and ensures reliable deployments even in poor reception areas.
Version 1.2.0
Secure Edge Services
Risk-free software rollouts with smart cellular resiliency
Introduction of strictly separated Dev/Test/Prod workspaces, time-limited device tokens, granular status tracking for over-the-air (OTA) container updates, and smart packet-retry logic for unstable cellular connections (LTE/5G).
Benefits: Software updates are isolated and validated in test environments before hitting production. Smart data transmission preserves cellular bandwidth and ensures reliable deployments even in poor reception areas.
Version 1.5.0
Industrial Data Manager
SQL-powered views, richer tables, and live flow indicators
This update brings SQL-based data manipulation in the visualization layer, richer tables with dynamic tooltips and KPI footers, and live flow direction indicators in canvas graphics driven by real process values.
Benefits:
Data manipulation via SQL expressions: The editing and transformation of query results from different data sources can now be carried out directly using SQL syntax. Benefit: Highly flexible data joins directly on the visualization layer, without deep backend interventions.
Generation of tooltips from table fields: In table panels, tooltips can be dynamically populated with content from other (including hidden) columns. This enables lean table layouts with maximum information depth via mouseover.
Multifunctional table footer: The table footer can now calculate and display multiple mathematical reductions (e.g. sum, average, min/max) simultaneously, in order to consolidate KPIs directly within data sheets.
Dynamic flow direction indicators in canvas graphics: Connections between plant components in the graphical editor can now change their arrow and flow direction based on actual field values. This visualizes flow or energy directions live on the shop floor screen.

Version 1.5.0
Industrial Data Manager
SQL-powered views, richer tables, and live flow indicators
This update brings SQL-based data manipulation in the visualization layer, richer tables with dynamic tooltips and KPI footers, and live flow direction indicators in canvas graphics driven by real process values.
Benefits:
Data manipulation via SQL expressions: The editing and transformation of query results from different data sources can now be carried out directly using SQL syntax. Benefit: Highly flexible data joins directly on the visualization layer, without deep backend interventions.
Generation of tooltips from table fields: In table panels, tooltips can be dynamically populated with content from other (including hidden) columns. This enables lean table layouts with maximum information depth via mouseover.
Multifunctional table footer: The table footer can now calculate and display multiple mathematical reductions (e.g. sum, average, min/max) simultaneously, in order to consolidate KPIs directly within data sheets.
Dynamic flow direction indicators in canvas graphics: Connections between plant components in the graphical editor can now change their arrow and flow direction based on actual field values. This visualizes flow or energy directions live on the shop floor screen.
Version 1.0.0
Experience-based Assistant
AI-Driven troubleshooting powered by proven expert knowledge
Launch of the iDOO Experience-based Assistant with AI-driven troubleshooting for faster problem-resolution and accelerated workforce development at the point of execution. The assistant provides symptom- and root-cause-driven diagnostics based on over 40+ years of service experience in plastics industry.
Benefits: Faster issue identification, higher first-time resolution rates, and reduced dependency on individual experts through consistent and reliable troubleshooting guidance.

Version 1.0.0
Experience-based Assistant
AI-Driven troubleshooting powered by proven expert knowledge
Launch of the iDOO Experience-based Assistant with AI-driven troubleshooting for faster problem-resolution and accelerated workforce development at the point of execution. The assistant provides symptom- and root-cause-driven diagnostics based on over 40+ years of service experience in plastics industry.
Benefits: Faster issue identification, higher first-time resolution rates, and reduced dependency on individual experts through consistent and reliable troubleshooting guidance.
Version 1.4.0
Industrial Data Manager
Faster tables, smoother canvas & more flexible filters
This release delivers smoother rendering for very large tables, an improved pan & zoom experience in the canvas editor, extra static options for query variables, and finer control over how aggregation intervals are aligned.
Benefits:
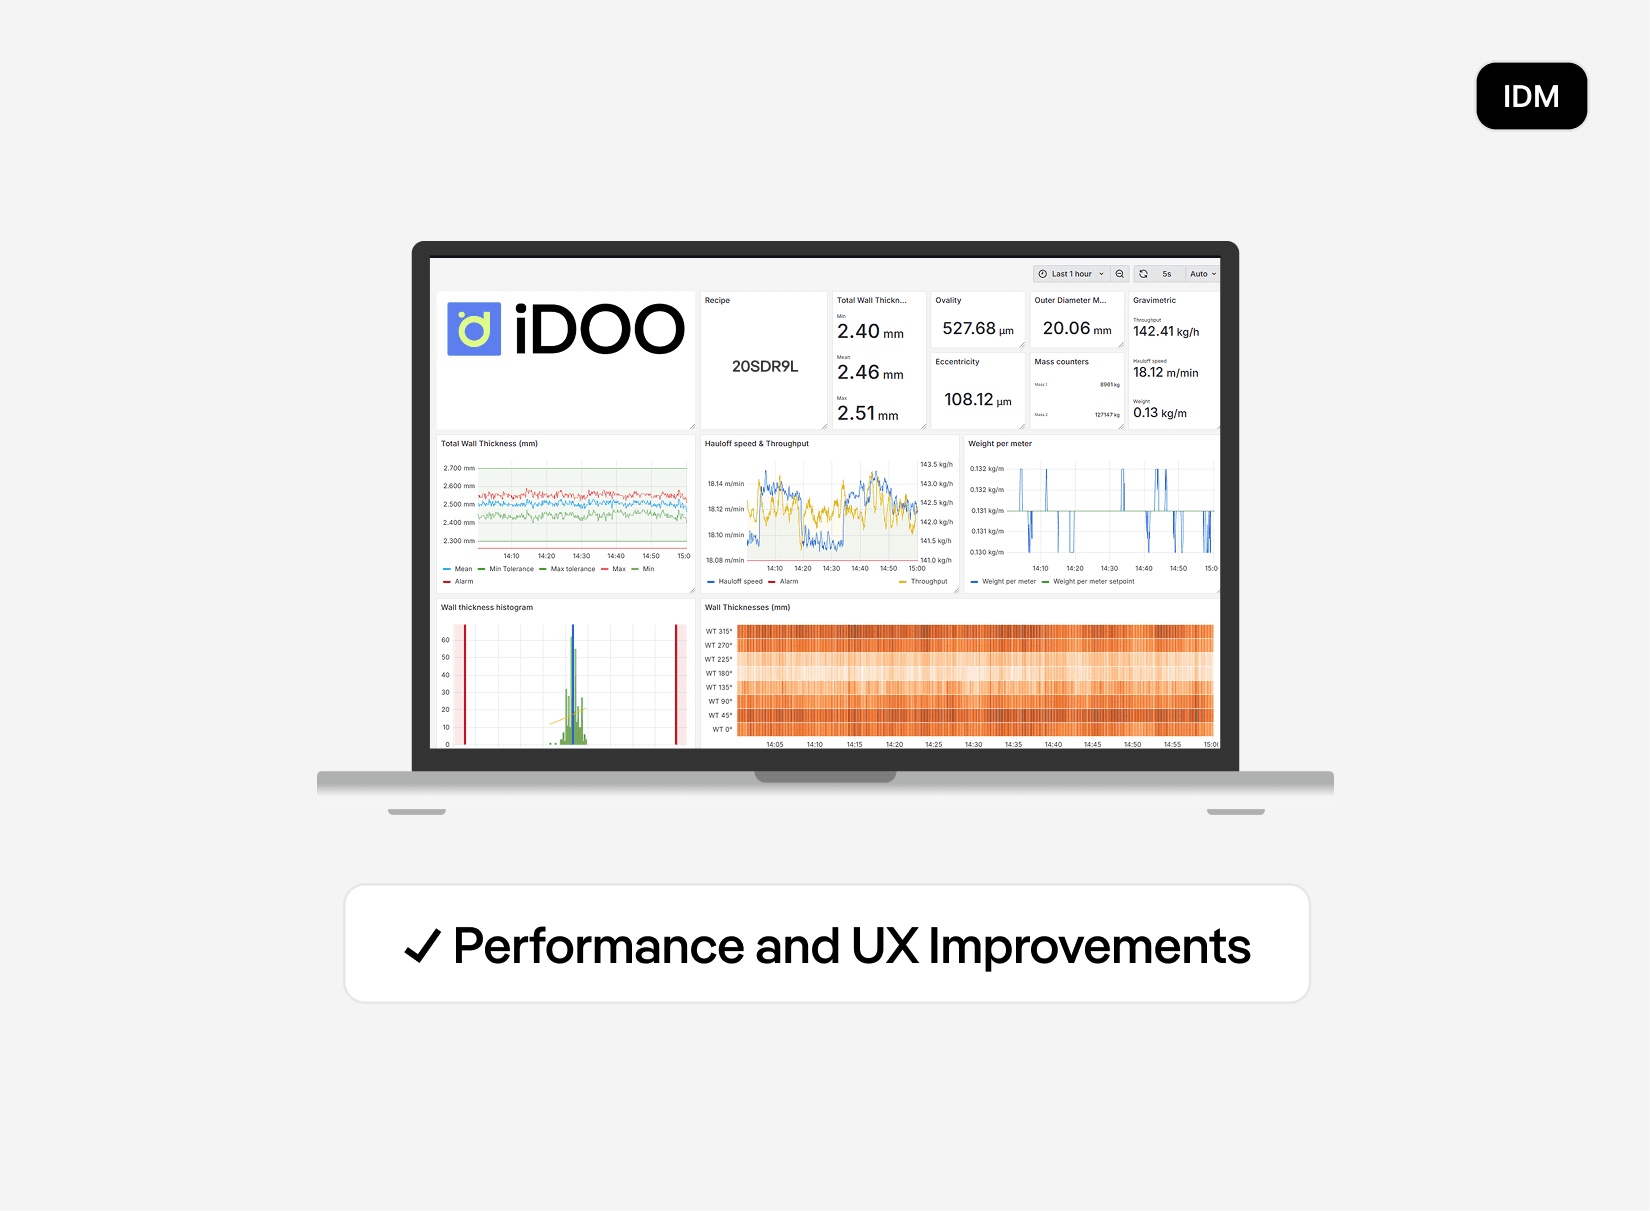
Significant performance boost for large tables: By refactoring the table panel to the react-data-grid library, massive data volumes and tens of thousands of rows are rendered smoothly and without delay in the browser.
Enhanced canvas pan & zoom experience: The visual process image editor has been optimized: elements can be placed without boundaries, backgrounds scale seamlessly, and a “zoom to content” button automatically adjusts the view to the screen size.
Static additional options for query variables: For dynamic data queries, additional fixed options can be manually prepended (e.g. “Value not defined” or “All plants”). This provides greater flexibility for dashboard filtering.
Improved alignment of aggregation intervals: New options make it possible to fix the starting point of mathematical aggregation intervals either strictly to the start of the query period or to a rounded interval.
Version 1.4.0
Industrial Data Manager
Faster tables, smoother canvas & more flexible filters
This release delivers smoother rendering for very large tables, an improved pan & zoom experience in the canvas editor, extra static options for query variables, and finer control over how aggregation intervals are aligned.
Benefits:
Significant performance boost for large tables: By refactoring the table panel to the react-data-grid library, massive data volumes and tens of thousands of rows are rendered smoothly and without delay in the browser.
Enhanced canvas pan & zoom experience: The visual process image editor has been optimized: elements can be placed without boundaries, backgrounds scale seamlessly, and a “zoom to content” button automatically adjusts the view to the screen size.
Static additional options for query variables: For dynamic data queries, additional fixed options can be manually prepended (e.g. “Value not defined” or “All plants”). This provides greater flexibility for dashboard filtering.
Improved alignment of aggregation intervals: New options make it possible to fix the starting point of mathematical aggregation intervals either strictly to the start of the query period or to a rounded interval.
Version 1.1.0
Secure Edge Services
Catch Network Faults Before Deployment with Smart Alerts
Integration of automatic OPC UA and MQTT connection pre-testing directly from the cloud UI, automated webhook alerts for offline device statuses, live resource monitoring (CPU/RAM) per individual Docker container, and a tamper-proof audit log.
Benefits: Maximum transparency and rapid troubleshooting. Faulty fieldbus connections are caught before app deployment. If a gateway goes offline, your IT ticketing system is alerted instantly, while the audit log tracks every single administrative change.
Version 1.1.0
Secure Edge Services
Catch Network Faults Before Deployment with Smart Alerts
Integration of automatic OPC UA and MQTT connection pre-testing directly from the cloud UI, automated webhook alerts for offline device statuses, live resource monitoring (CPU/RAM) per individual Docker container, and a tamper-proof audit log.
Benefits: Maximum transparency and rapid troubleshooting. Faulty fieldbus connections are caught before app deployment. If a gateway goes offline, your IT ticketing system is alerted instantly, while the audit log tracks every single administrative change.
Version 1.0.0
Secure Edge Services
Initial release: base services deployed
Usage of Secure Edge Device and IIOT Cloud as base for a wide range of services.
Safe remote service and support for the infrastructure behind the gateway
Also integration of production-related data services
Secure by design
Version 1.0.0
Secure Edge Services
Initial release: base services deployed
Usage of Secure Edge Device and IIOT Cloud as base for a wide range of services.
Safe remote service and support for the infrastructure behind the gateway
Also integration of production-related data services
Secure by design
Version 1.3.0
Industrial Data Manager
Only-changes streaming, hierarchical events, and smarter labels
This update introduces an “OnlyChanges” interface filter for faster time-series delivery, parent-aware event queries with fine-grained property filters, and automatic use of tag descriptions as labels for clearer dashboards.
Benefits:
Interface filter “OnlyChanges” for measurements: When retrieving time-series data via the interface, consecutive identical values can be ignored if desired. Benefit: Reduces network overhead and drastically speeds up dashboard rendering, since only actual value changes are transferred.
Parent event hierarchies in queries: Event queries can now structurally include parent information (e.g. to see which overarching major downtime a smaller micro-interruption belongs to).
Extended event property filters: Full compatibility with fine-grained value filters for event dimensions, allowing complex event scenarios to be narrowed down without any loss of performance.
Tag descriptions available as labels: Descriptions of measurements or asset properties are now directly available as data labels in query results. Dashboards can therefore name axes and legends in an automatically understandable way.
Version 1.3.0
Industrial Data Manager
Only-changes streaming, hierarchical events, and smarter labels
This update introduces an “OnlyChanges” interface filter for faster time-series delivery, parent-aware event queries with fine-grained property filters, and automatic use of tag descriptions as labels for clearer dashboards.
Benefits:
Interface filter “OnlyChanges” for measurements: When retrieving time-series data via the interface, consecutive identical values can be ignored if desired. Benefit: Reduces network overhead and drastically speeds up dashboard rendering, since only actual value changes are transferred.
Parent event hierarchies in queries: Event queries can now structurally include parent information (e.g. to see which overarching major downtime a smaller micro-interruption belongs to).
Extended event property filters: Full compatibility with fine-grained value filters for event dimensions, allowing complex event scenarios to be narrowed down without any loss of performance.
Tag descriptions available as labels: Descriptions of measurements or asset properties are now directly available as data labels in query results. Dashboards can therefore name axes and legends in an automatically understandable way.
Version 1.2.0
Industrial Data Manager
Precise time ranges, interactive variables, and cleaner signals
This update adds aggregations over the exact dashboard time range, interactive variables based on unique event properties, and direct value filtering in time-series queries to remove outliers at the source.
Benefits:
Data aggregation over the entire dashboard period: Users can dynamically calculate aggregations (such as total consumption) over exactly the time window selected in the dashboard, instead of having to rely on fixed intervals.
Variable queries for unique event properties: Dynamic dashboard variables can now query specific, unique values of event properties directly from the database, increasing interactivity for end users.
Value filtering directly in time-series queries: Introduction of direct value filters in mathematical time-series queries in order to filter out outliers or irrelevant states directly at the data source.

Version 1.2.0
Industrial Data Manager
Precise time ranges, interactive variables, and cleaner signals
This update adds aggregations over the exact dashboard time range, interactive variables based on unique event properties, and direct value filtering in time-series queries to remove outliers at the source.
Benefits:
Data aggregation over the entire dashboard period: Users can dynamically calculate aggregations (such as total consumption) over exactly the time window selected in the dashboard, instead of having to rely on fixed intervals.
Variable queries for unique event properties: Dynamic dashboard variables can now query specific, unique values of event properties directly from the database, increasing interactivity for end users.
Value filtering directly in time-series queries: Introduction of direct value filters in mathematical time-series queries in order to filter out outliers or irrelevant states directly at the data source.
Version 1.1.0
Industrial Data Manager
Live Excel add-in, smarter events, and more powerful dashboards
This release introduces a native Excel add-in for live IDM data, manual event creation on the shop floor, more flexible dashboard variables, and new aggregation options for complex PLC data arrays.
Benefits:
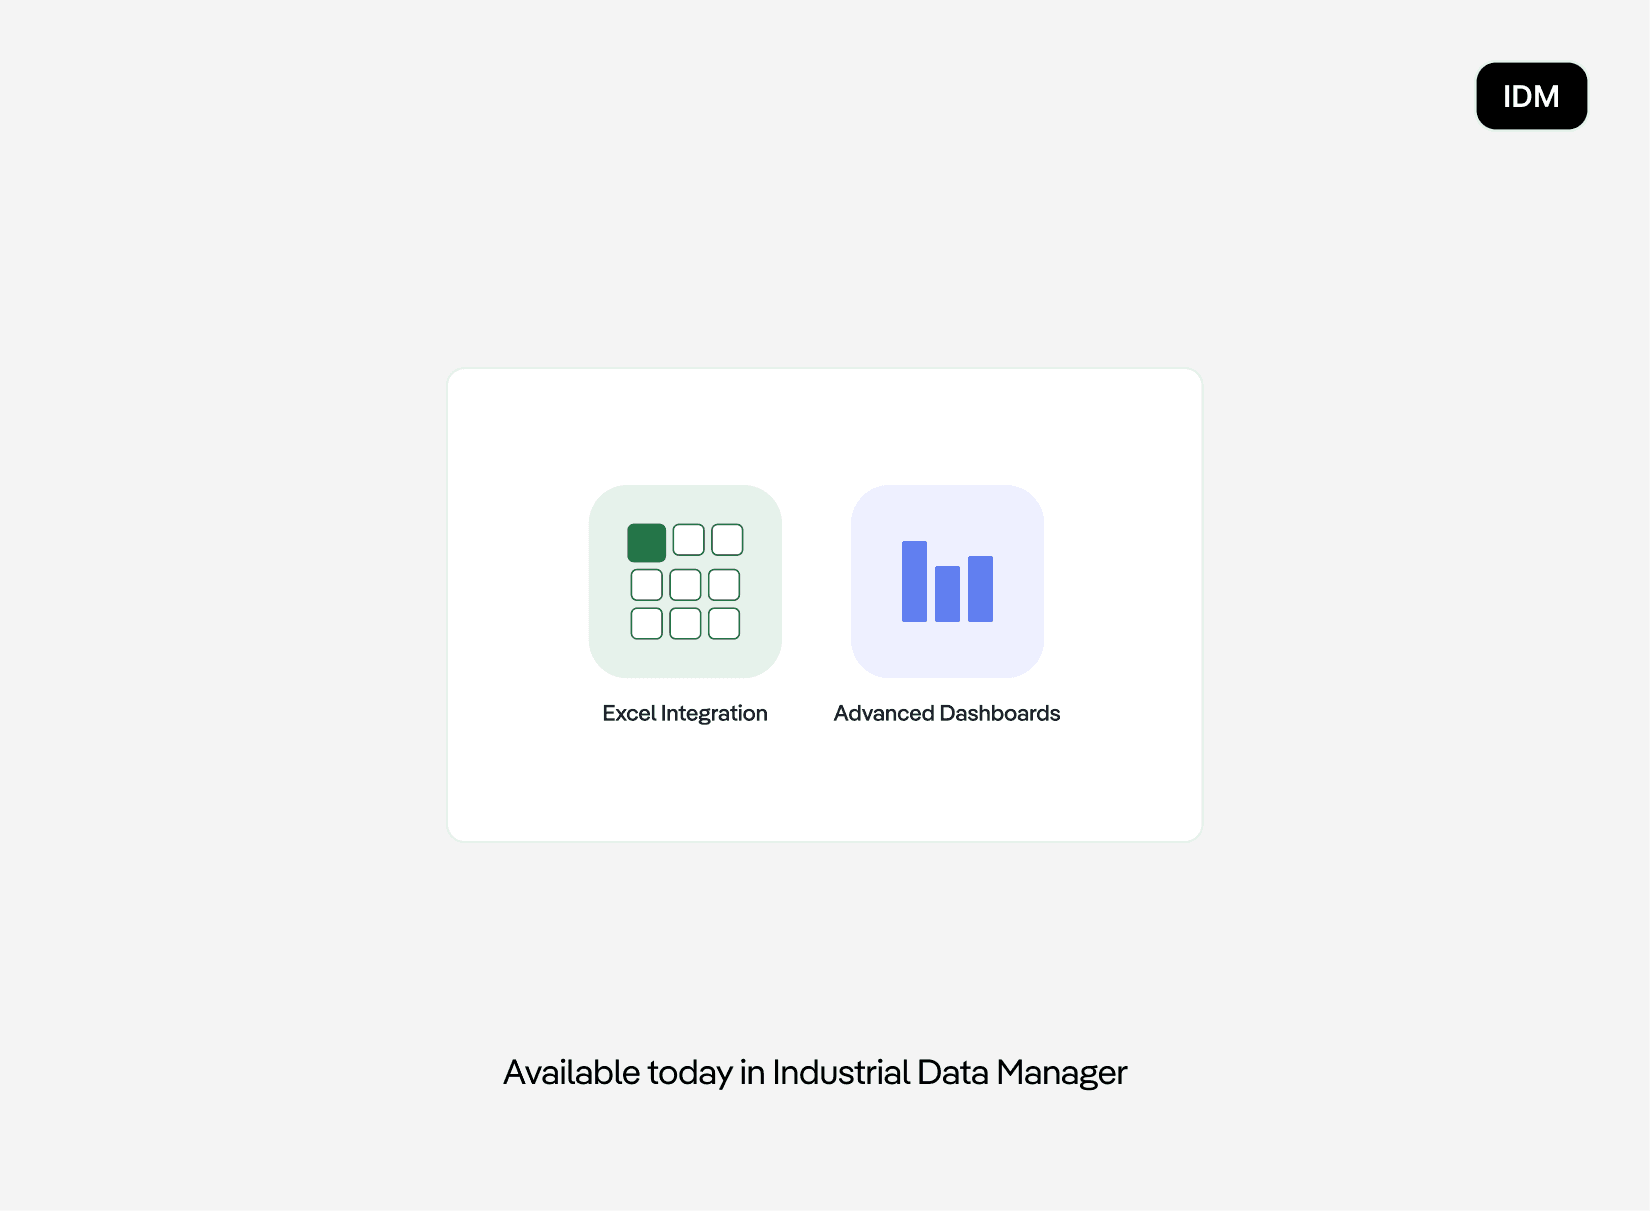
Native Microsoft Excel add-in for live data: Introduction of a direct interface to Excel. Users can load and update historical process and event data directly from the IDM into their Excel worksheets. Benefit: Data provision for engineers and controlling in their familiar working environment without manual file exports.
Manual event creation on the shop floor: Operators can manually log important events (e.g., manual quality inspections, shift notes, or unplanned disruptions) in the system that are not automatically captured by sensors.
Comprehensive dashboard variable editors: Introduction of dedicated query editors for variables (databases, assets, asset properties, event types). Benefit: Dashboards can be built with extremely high flexibility; a single dashboard can be used for hundreds of different machines via a simple dropdown.
Extended aggregation options for array data types: Targeted aggregation functions such as First, Last, and Count are now available for complex data arrays to process advanced PLC data structures seamlessly.
Version 1.1.0
Industrial Data Manager
Live Excel add-in, smarter events, and more powerful dashboards
This release introduces a native Excel add-in for live IDM data, manual event creation on the shop floor, more flexible dashboard variables, and new aggregation options for complex PLC data arrays.
Benefits:
Native Microsoft Excel add-in for live data: Introduction of a direct interface to Excel. Users can load and update historical process and event data directly from the IDM into their Excel worksheets. Benefit: Data provision for engineers and controlling in their familiar working environment without manual file exports.
Manual event creation on the shop floor: Operators can manually log important events (e.g., manual quality inspections, shift notes, or unplanned disruptions) in the system that are not automatically captured by sensors.
Comprehensive dashboard variable editors: Introduction of dedicated query editors for variables (databases, assets, asset properties, event types). Benefit: Dashboards can be built with extremely high flexibility; a single dashboard can be used for hundreds of different machines via a simple dropdown.
Extended aggregation options for array data types: Targeted aggregation functions such as First, Last, and Count are now available for complex data arrays to process advanced PLC data structures seamlessly.
Version 1.0.0
Industrial Data Manager
Initial release: Storage and visualization of your production data
Long time storage and visualization of production data in Extrusion processes
Compatible with machines having a OPC-UA interface
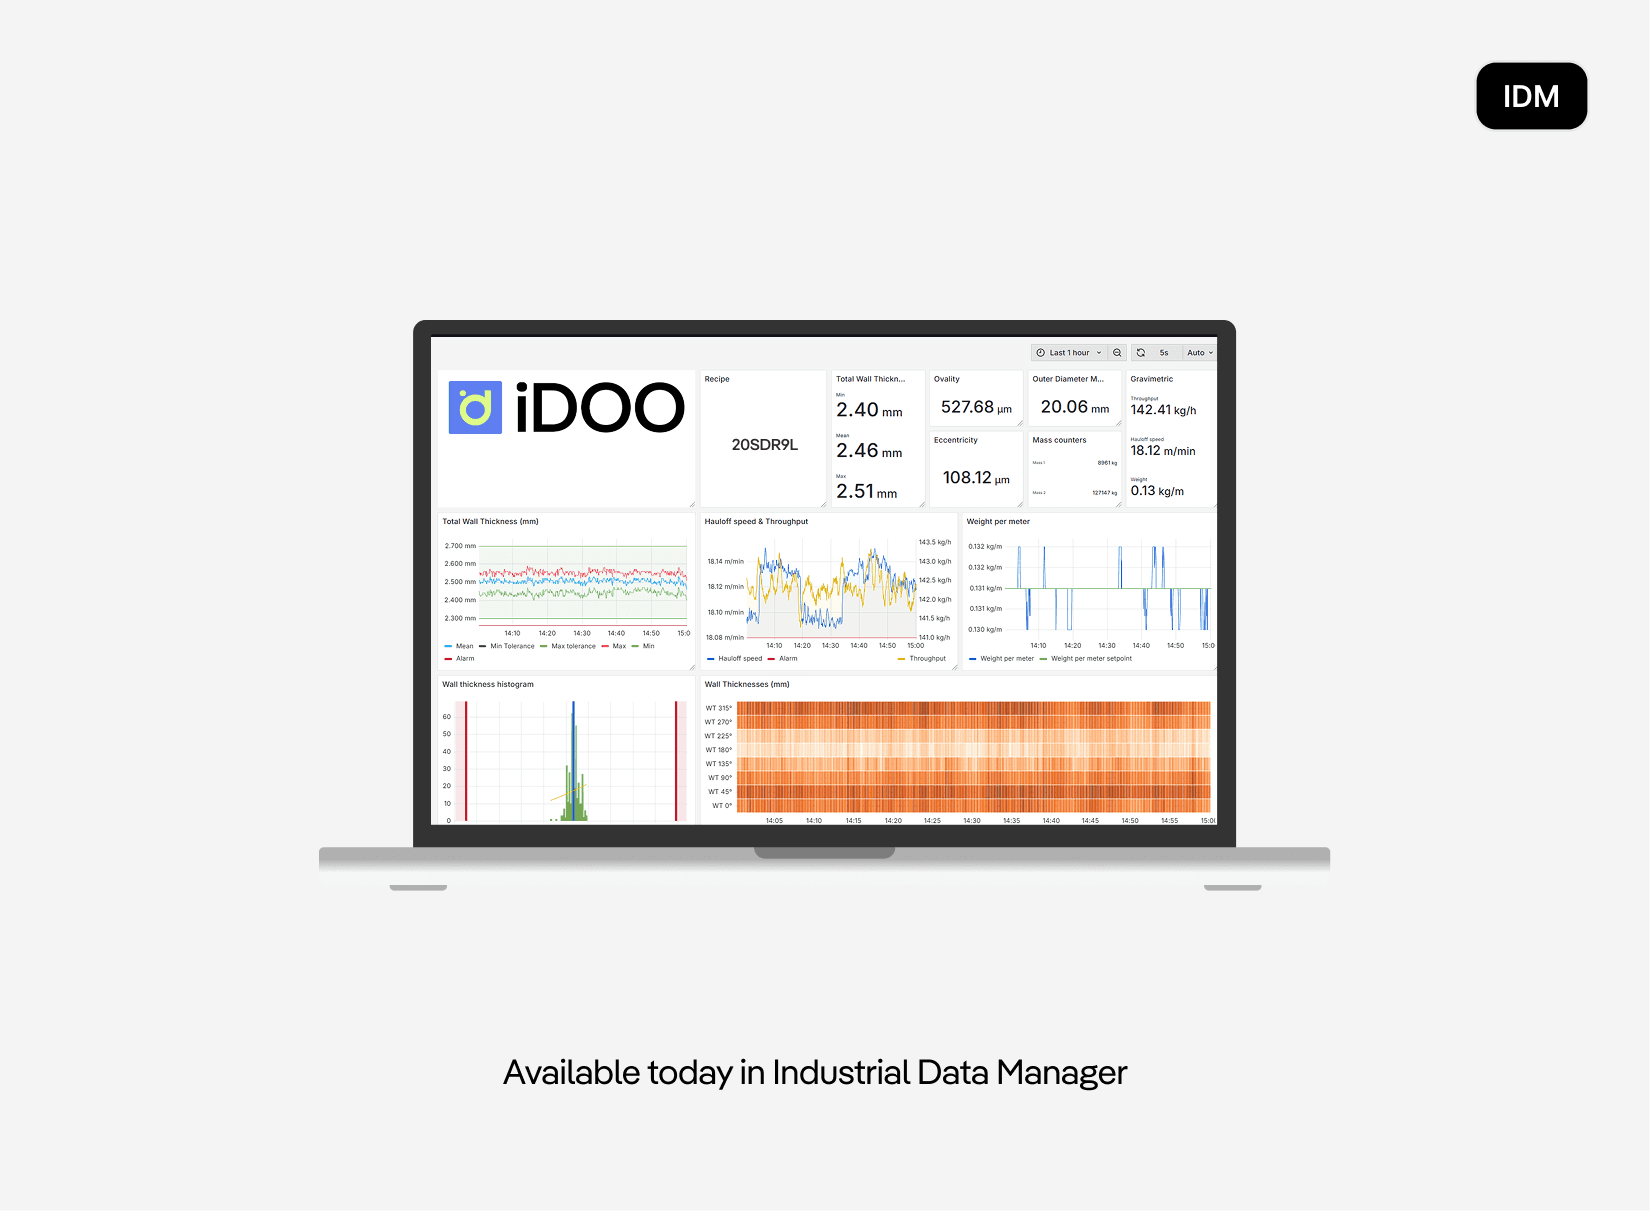
Benefits: Local or cloud based storage of your production process. Gives an insight of the process, of history and transparency. The Factry Historian ensures guaranteed uninterrupted storage of your process data, while Grafana presents the data in a clear and structured way. With selectable time scales, you can get an overview of the last few minutes as well as the past 30 days or more.
Version 1.0.0
Industrial Data Manager
Initial release: Storage and visualization of your production data
Long time storage and visualization of production data in Extrusion processes
Compatible with machines having a OPC-UA interface
Benefits: Local or cloud based storage of your production process. Gives an insight of the process, of history and transparency. The Factry Historian ensures guaranteed uninterrupted storage of your process data, while Grafana presents the data in a clear and structured way. With selectable time scales, you can get an overview of the last few minutes as well as the past 30 days or more.